SEI in 2013 - NEW DIRECTIONS
This interactive report offers a snapshot of a year in the life of SEI – a year of transition, new directions and new partnerships.
By scrolling down you can find key information about the institute; meet our staff, who tell their own stories on film; and review our work in 2013 by browsing through the infographics and the interactive world map.
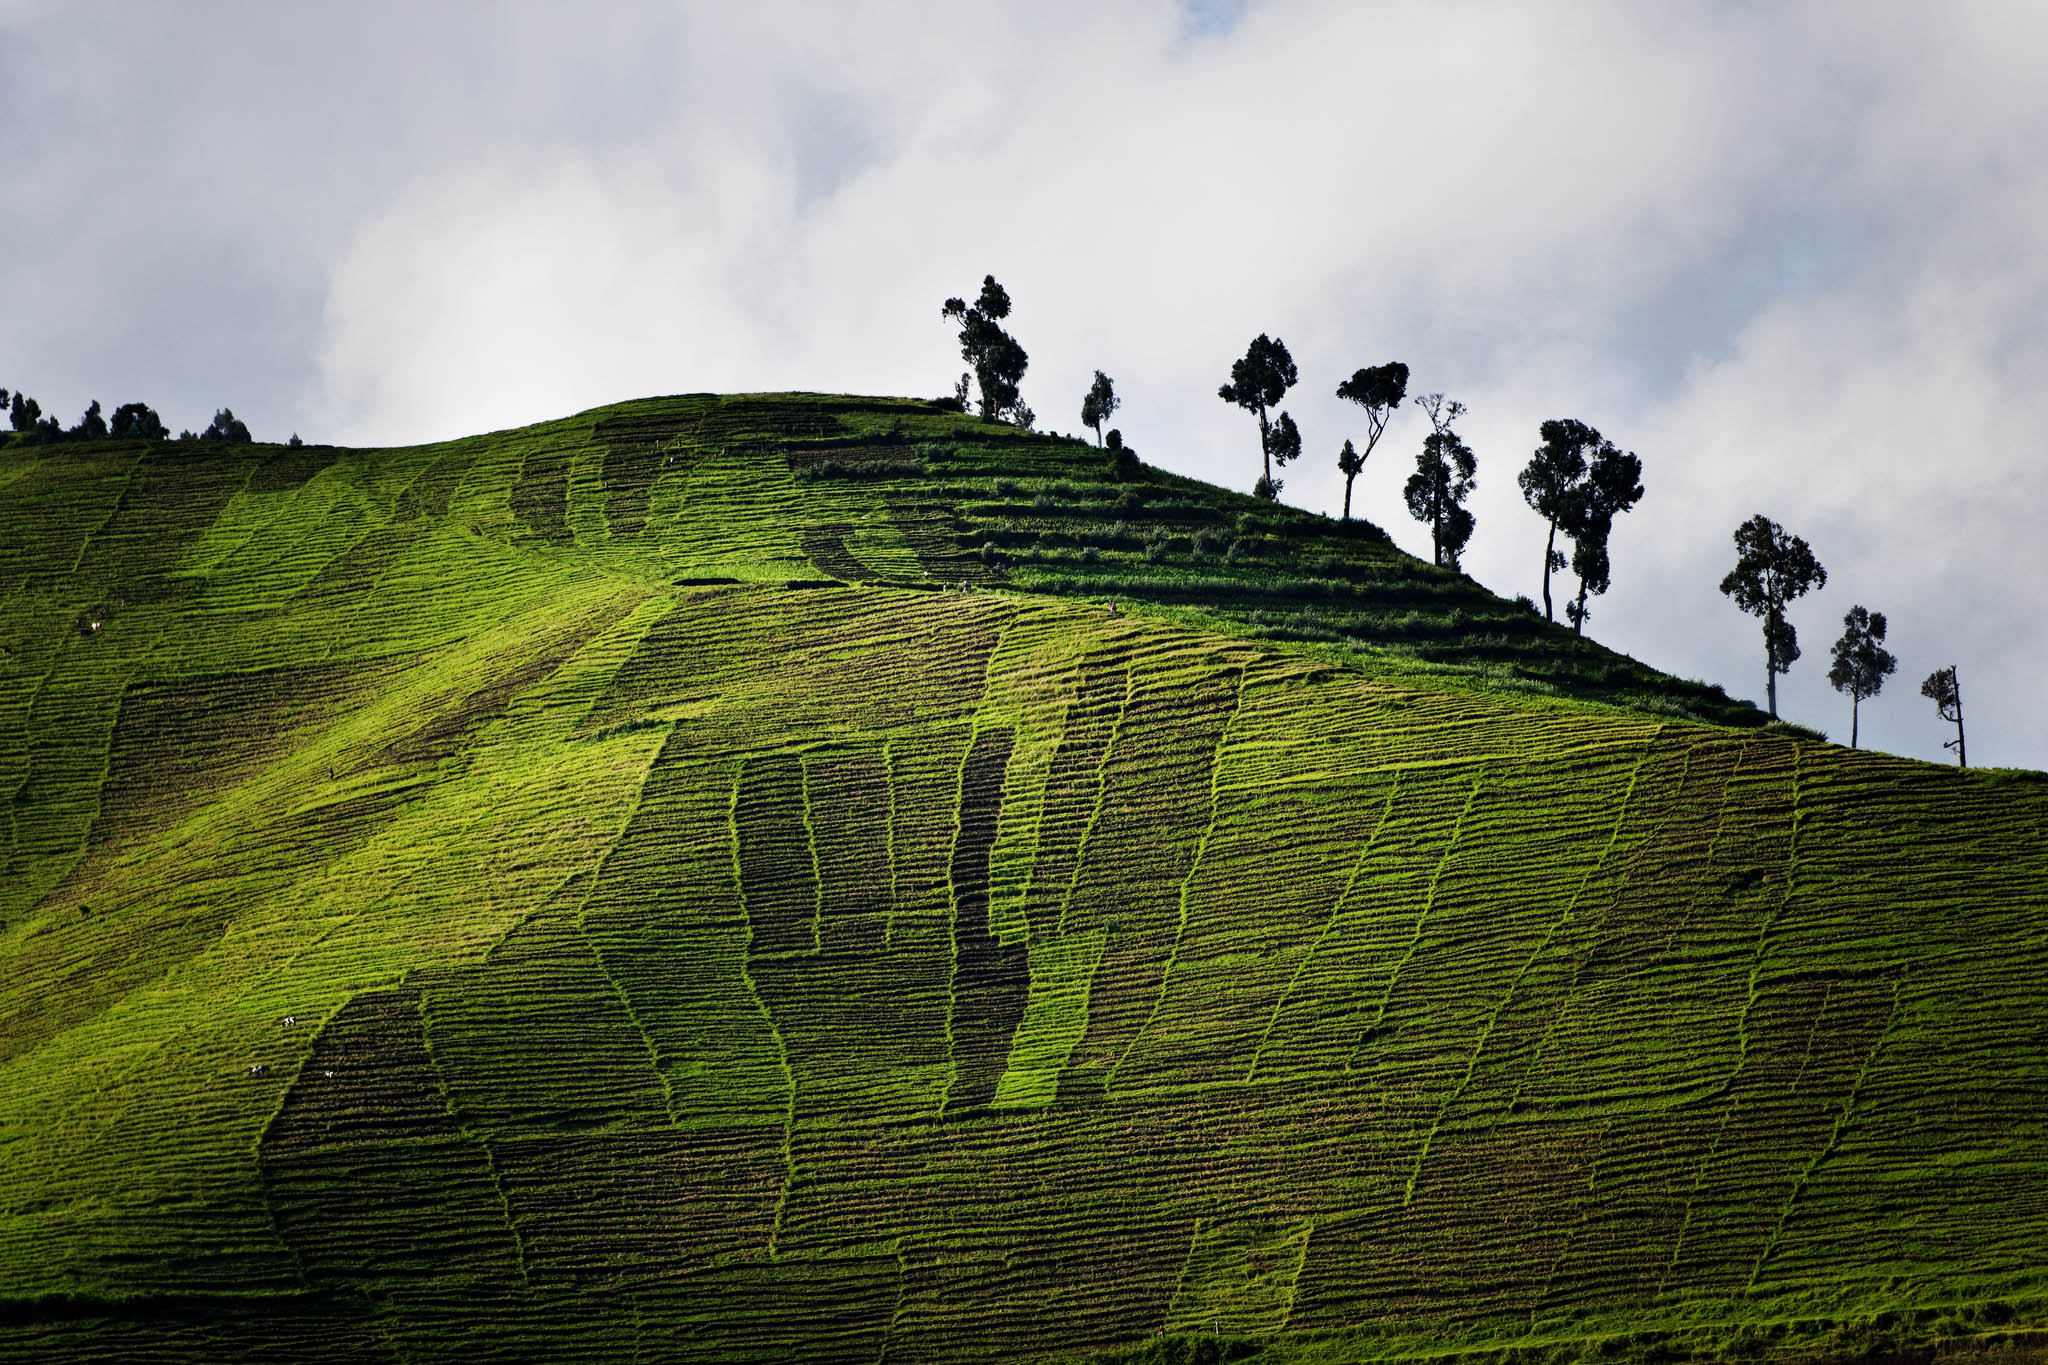
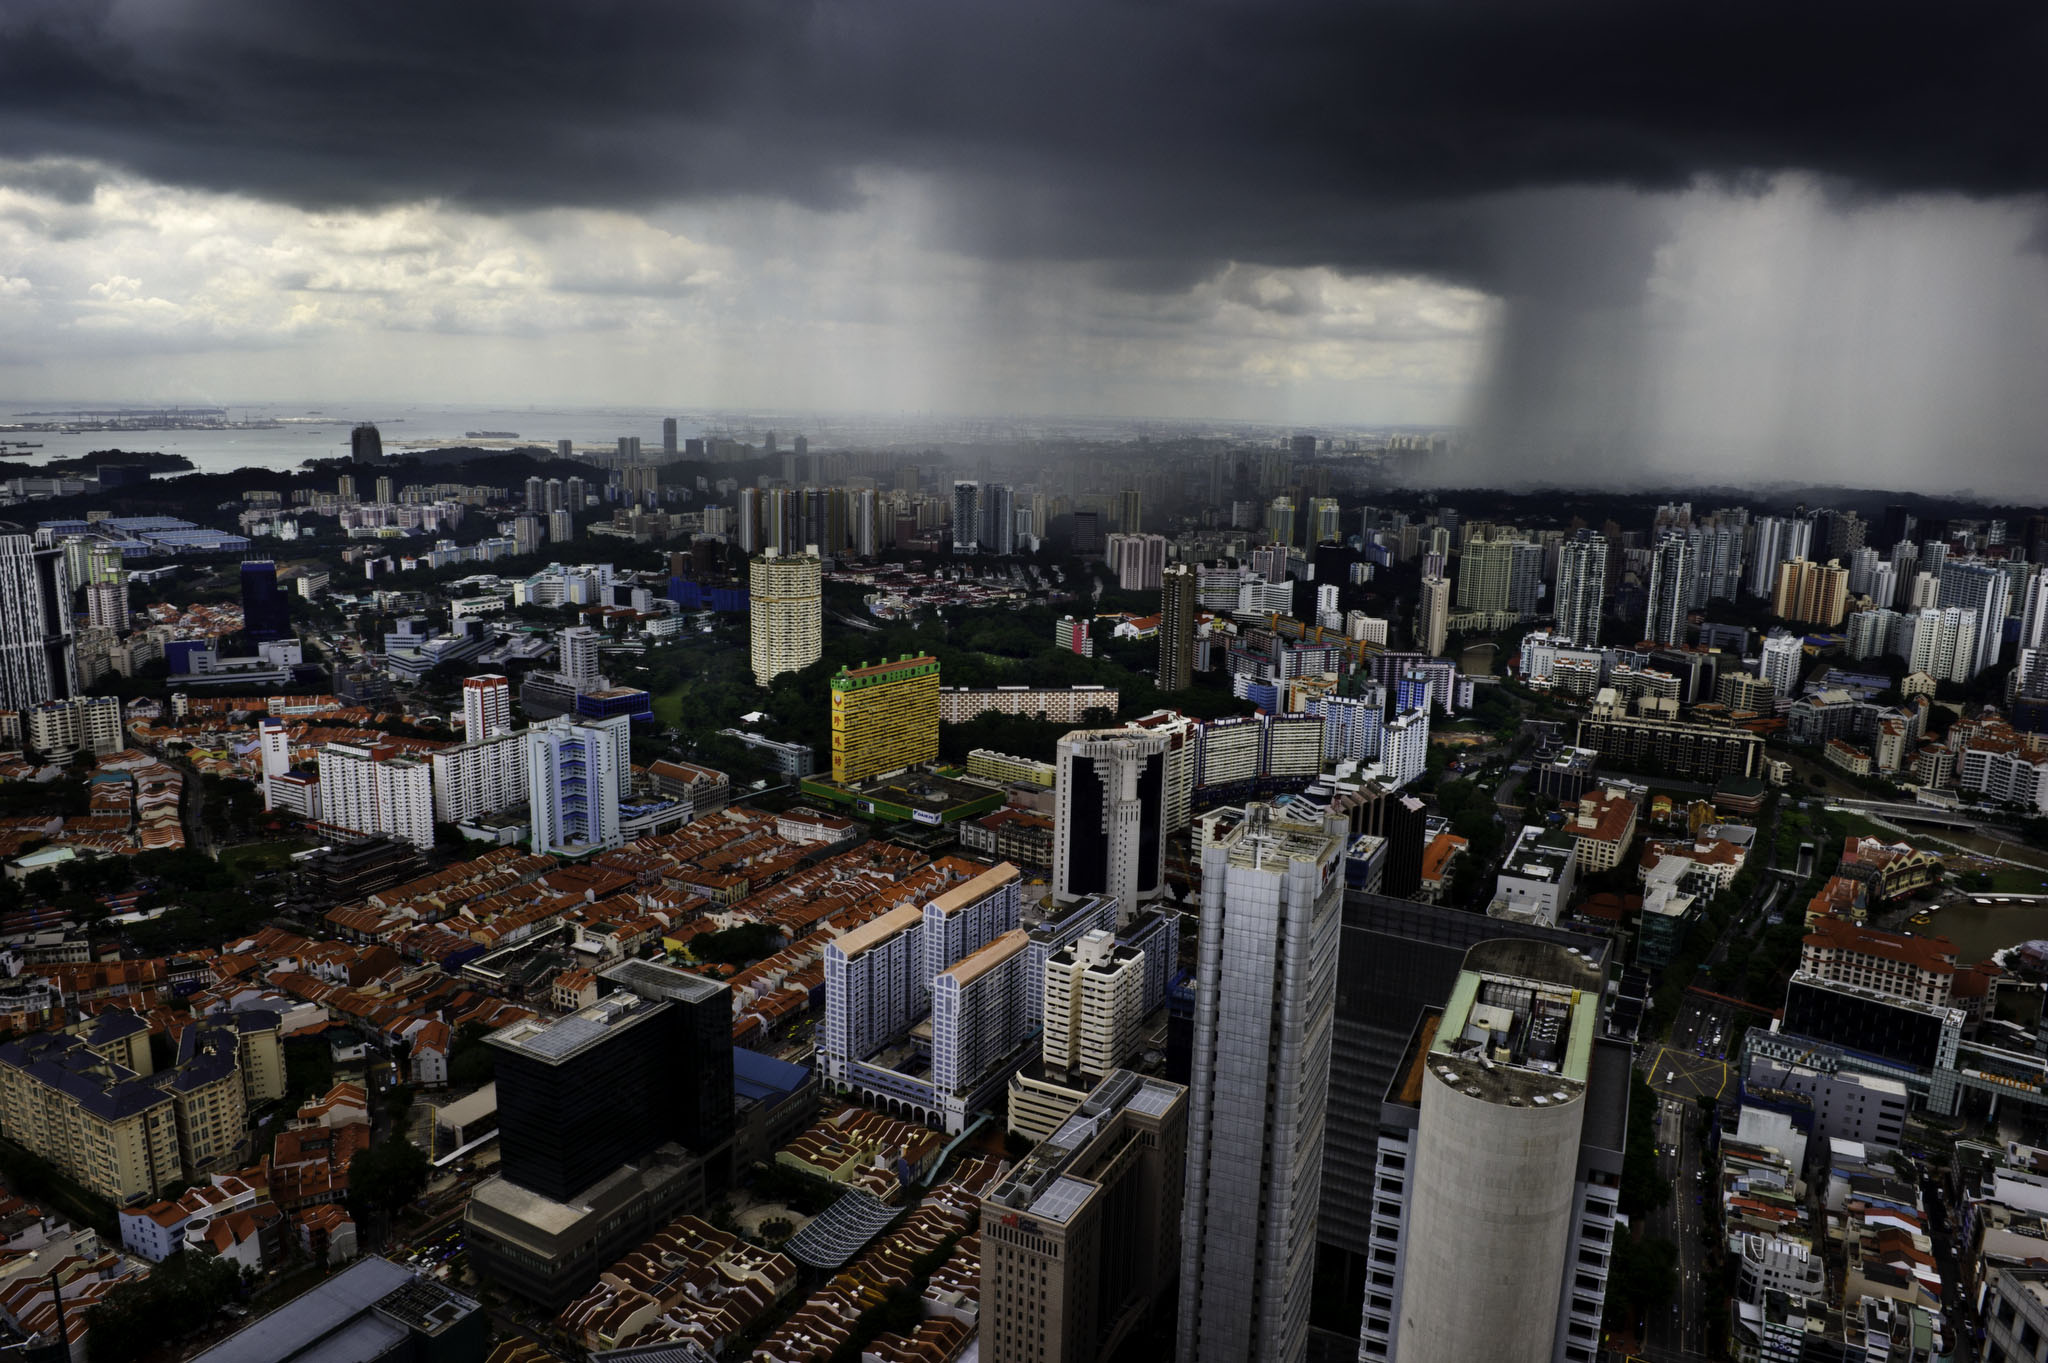
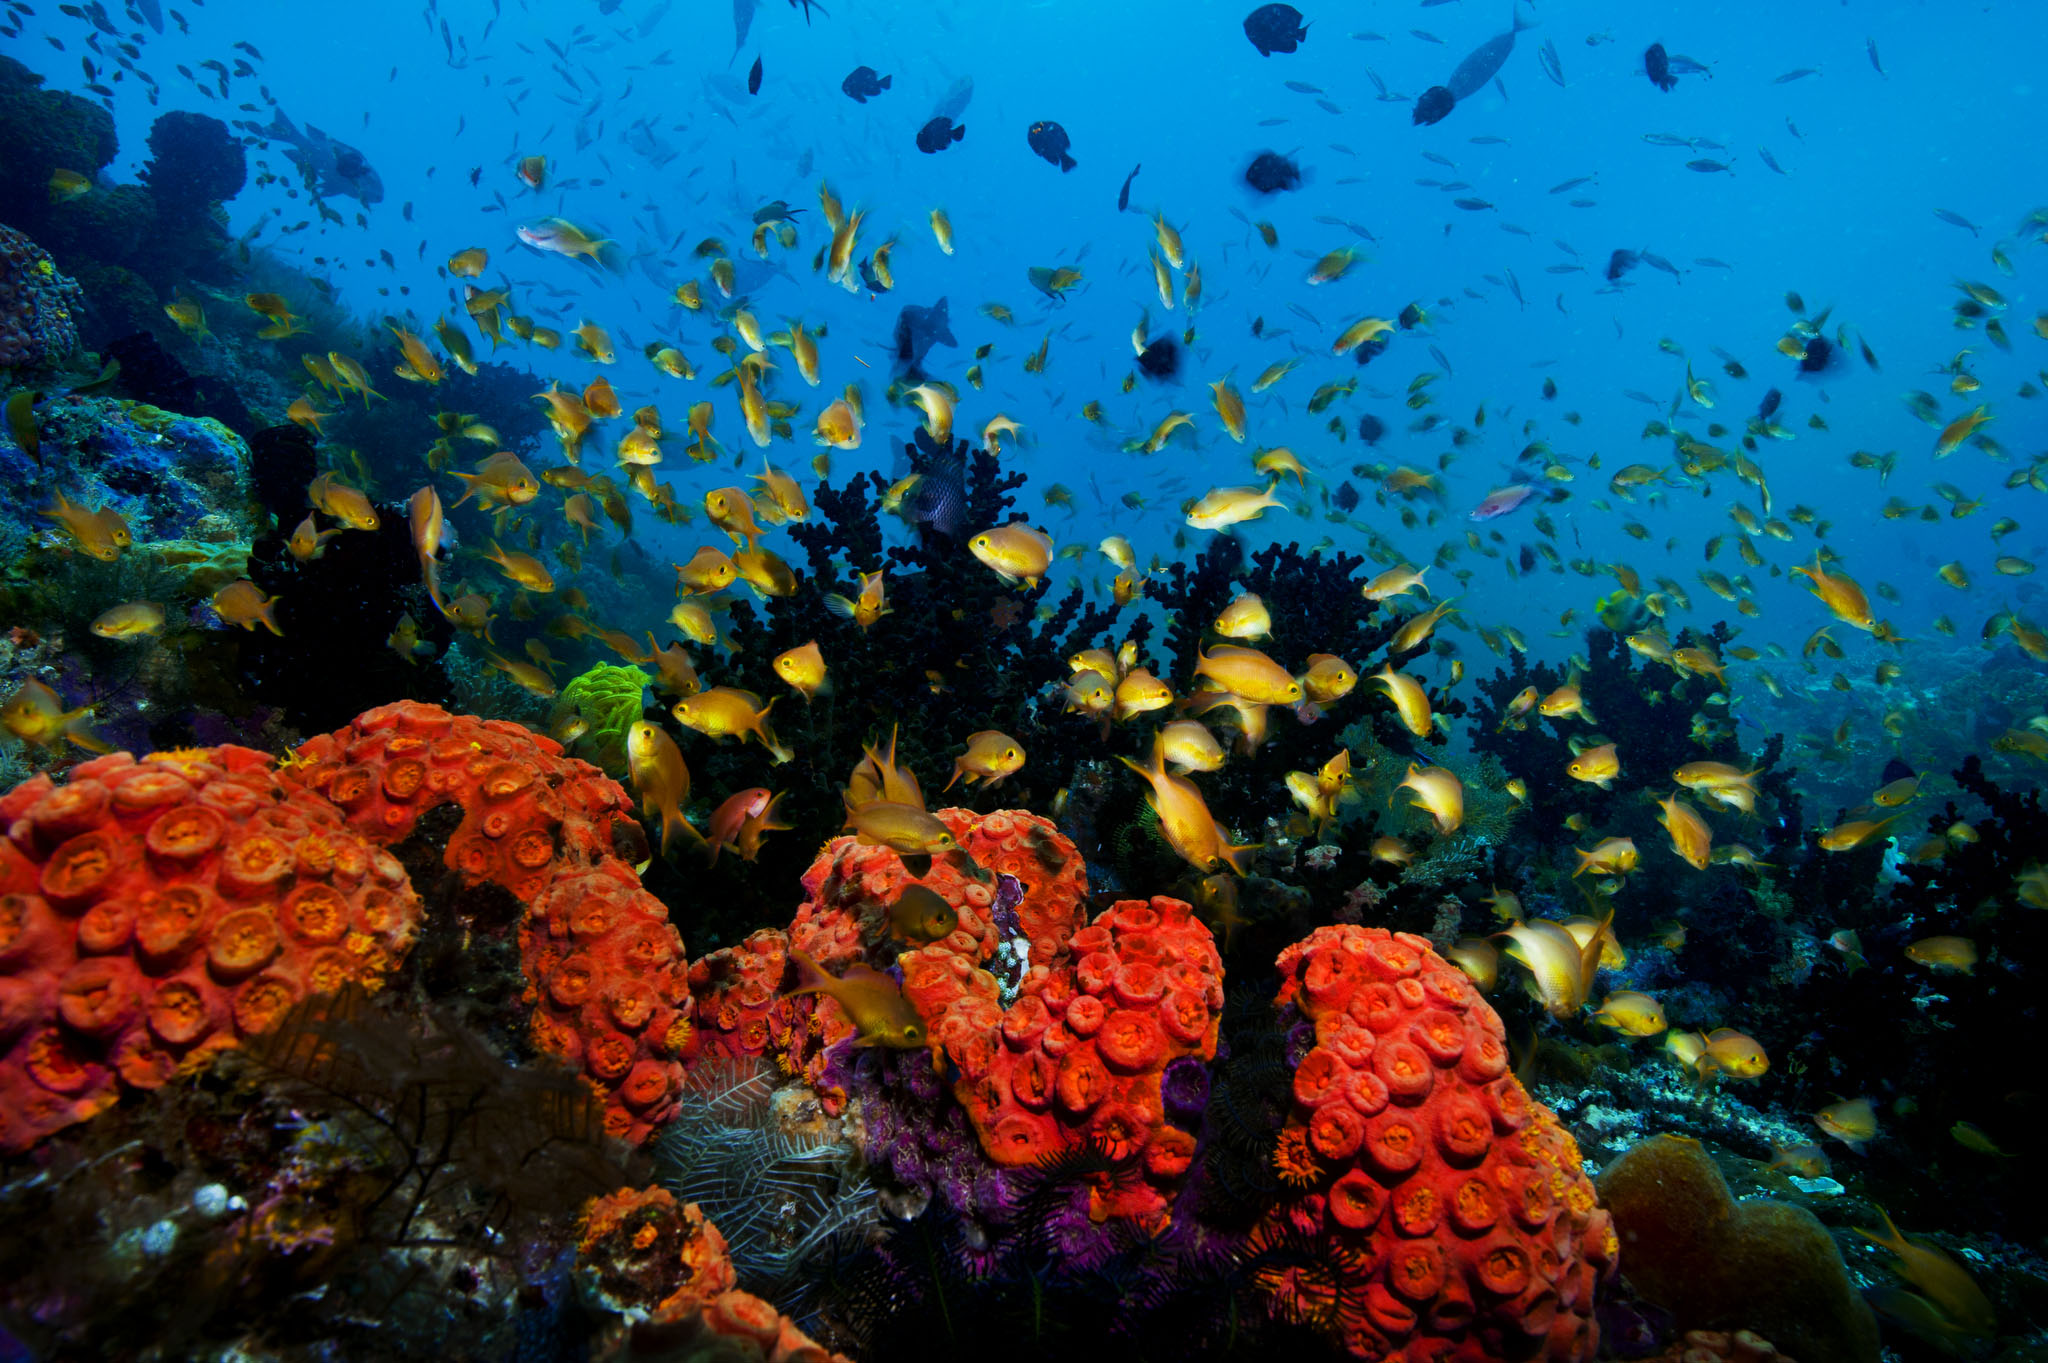
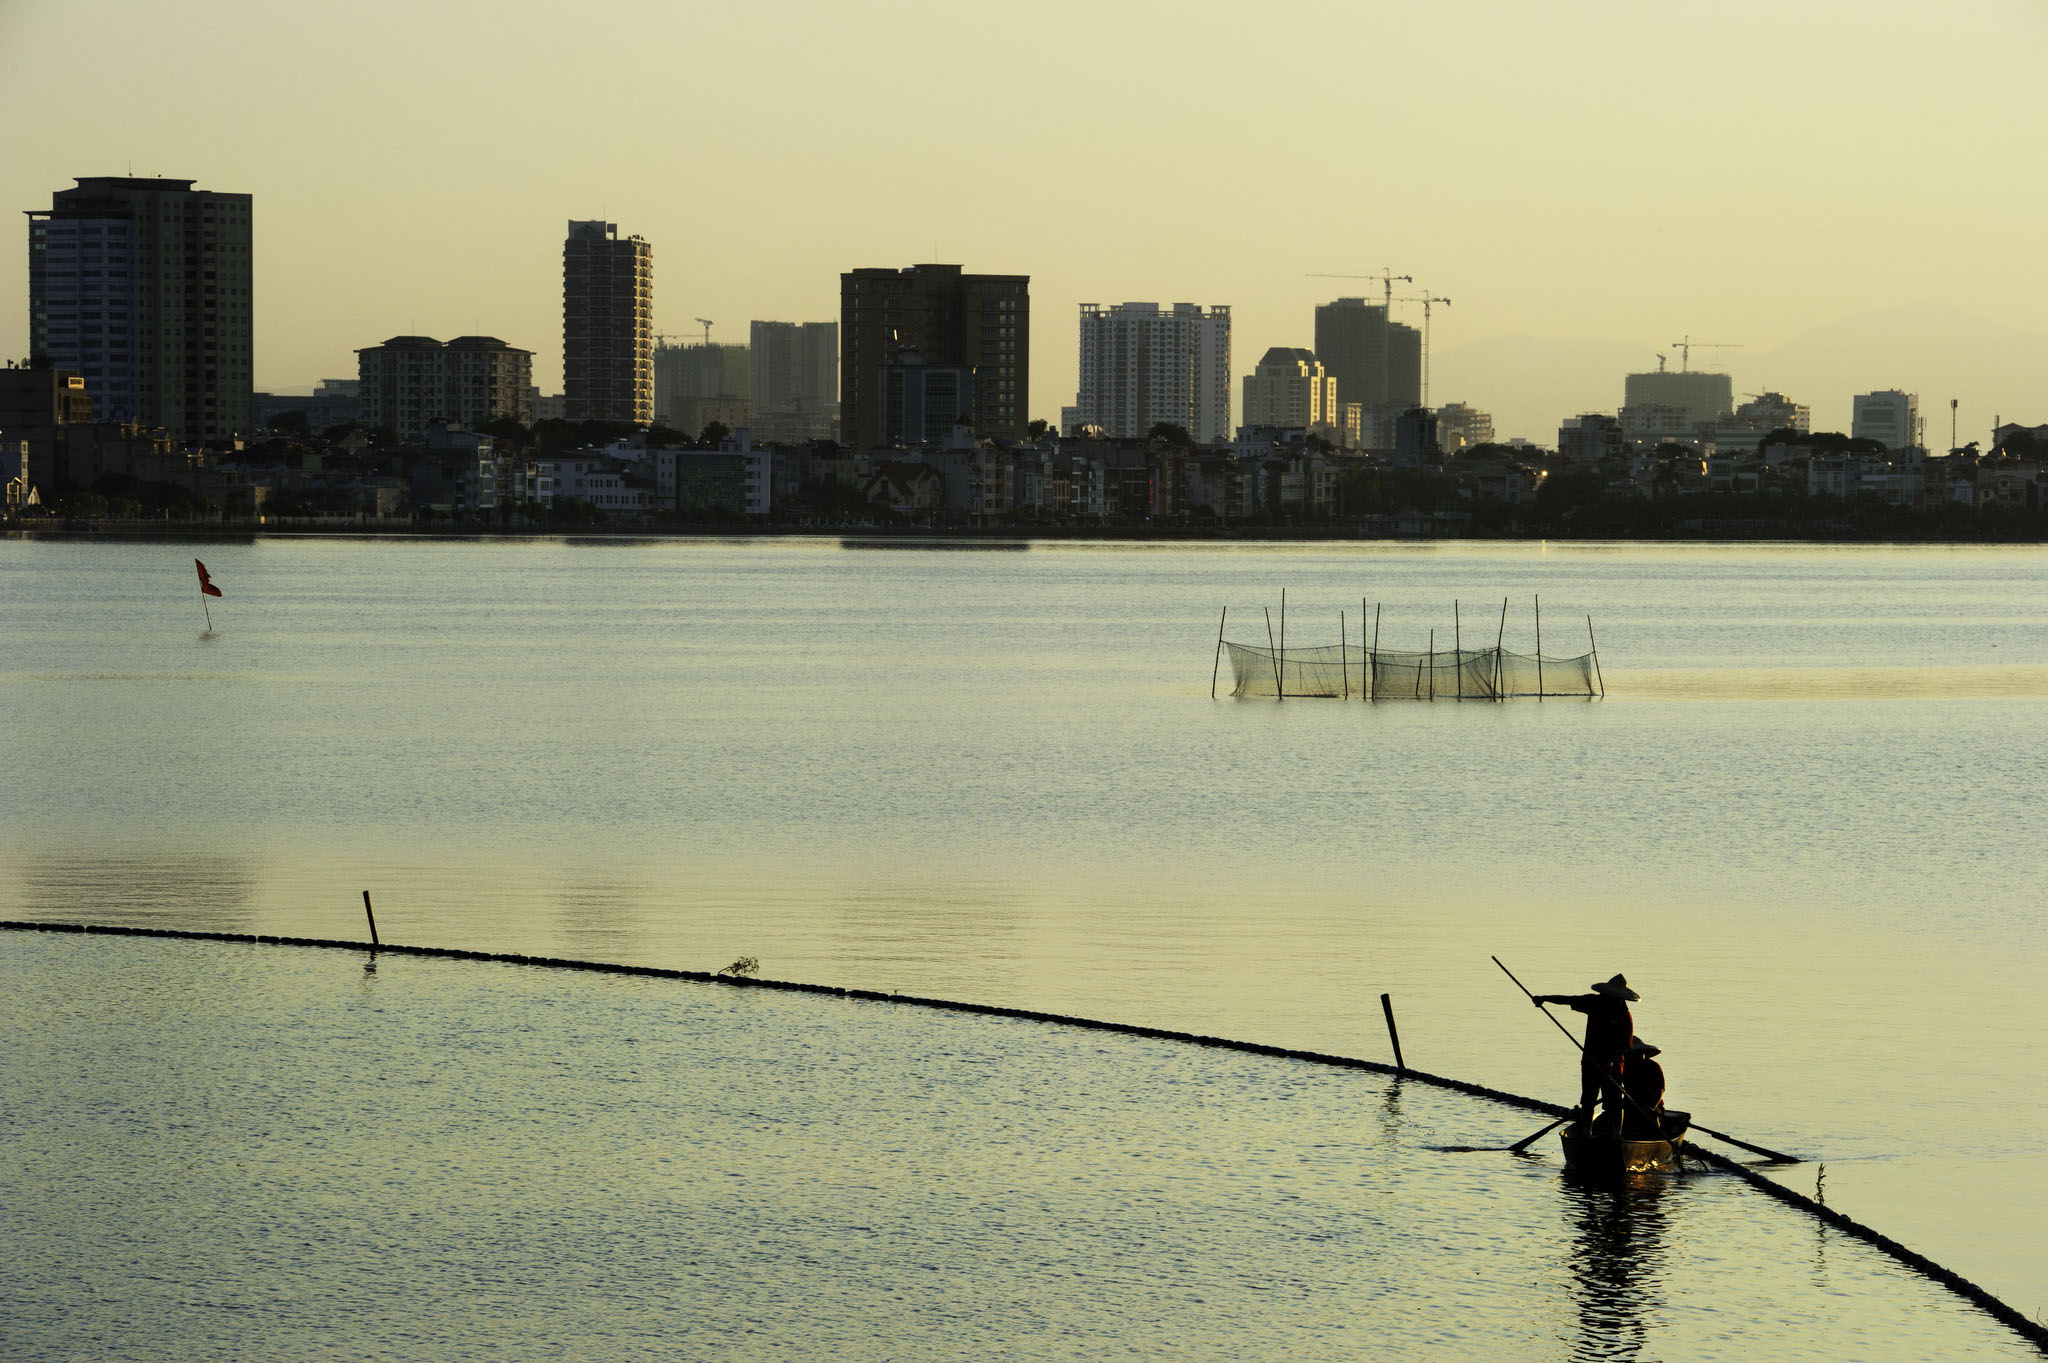
The map – which includes almost all of last year’s key activities and publications – allows you to make your own choice about which areas of our work you want to explore by navigating between topics and locations. The report is also illuminated by a set of superb photos taken by renowned National Geographic photographer Mattias Klum.
How we work
Our research tackles overarching issues such as climate change, energy systems, food security, water and urbanization, as well as specific problems like air pollution at the local level. In addition, SEI has developed modeling tools that help thousands of decision-makers and practitioners around the globe to make smarter decisions about water and energy use.
SEI convenes seminars and conferences that bring decision-makers, academics, and practitioners together to debate key issues and share knowledge. We also engage in and inform policy processes, development action, and business practice throughout the world.
BRIDGING SCIENCE AND POLICY
SEI combines scientific research with policy analysis, turning knowledge into action by connecting its work to decision-makers and civil society, linking science with development, and promoting social and environmental sustainability.
We also take a highly collaborative approach: stakeholder involvement has always been at the heart of our efforts to build capacity, strengthen institutions, and equip partners for the long term.
SEI is:
- international – SEI is distributed across nine locations around the world. SEI works locally, regionally, and globally, and has a diverse international staff
- trusted – both policy-makers and the academic community recognize us as an independent and non-partisan institute
- credible – our research is objective, and supported by a rigorous system of internal and external peer review
- integrated – only joined-up research can solve joined-up problems. SEI places a strong emphasis on making connections across the natural, physical, and social sciences, allowing us to approach sustainability challenges from new angles and offer robust and insightful policy advice.
Our people
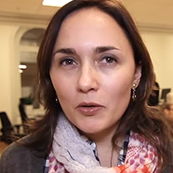
Our 180 staff represent around 30 countries. In the video wall below, some of our staff introduce themselves and talk about their work.
If you want to find out more about which researchers are connected to particular activities you can use the interactive map: clicking on an item and select ‘read article’.
You can also click here to find contact information and short bios for our entire staff.
Escobar SEI U.S.
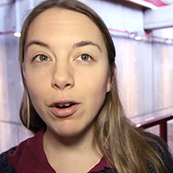
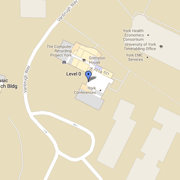
West SEI York
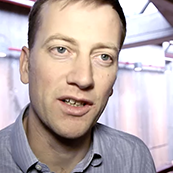
Gardner SEI Stockholm
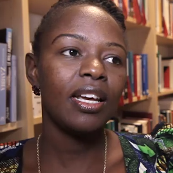
Senyagwa SEI Africa
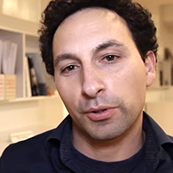
Godar SEI Stockholm
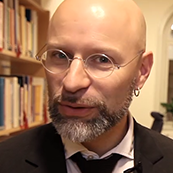
Carlsen SEI Stockholm
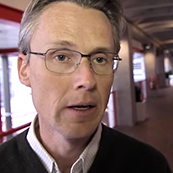
Nilsson SEI Stockholm
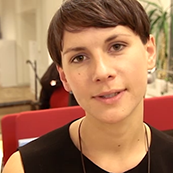
Jürisoo SEI Stockholm
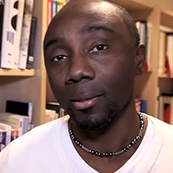
Ekane SEI Stockholm
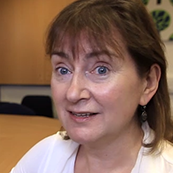
Roe SEI York

Nguyen SEI Asia
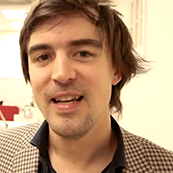
Erickson SEI U.S.
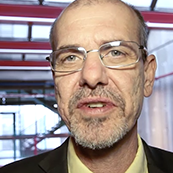
Purkey SEI U.S.
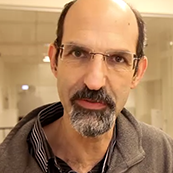
Lazarus SEI U.S.
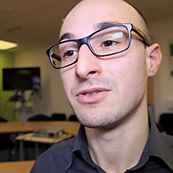
Rinaldi SEI York
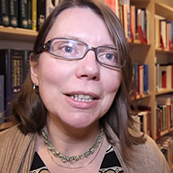
Butterfield SEI Oxford
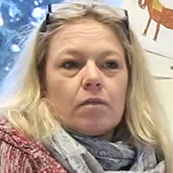
Barron SEI York
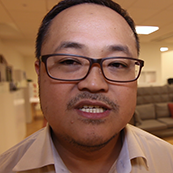
Salamanca SEI Asia
Our work in 2013
SEI works at the intersection of environment and development. We strive to take integrated approaches to research, practice and communications, and look at issues such as climate change, food security, water and energy in a joined up way.
The interactive map in the next section visualizes thematic connections between our various activities by linking them on the basis of topics that they share in common. It gives you control over what aspects of our work you want to discover, and offers you the choice to go in unexpected directions.
We gathered our activities in 2013 under seven topics (see below), and the map shows where they are located and links between them: a connection is shown when items have two or more of the topics in common.
Topics
Click on a topic to learn more.
Access to energy is vital for human development. At the same time, many of the ways that we use and produce energy are polluting, resource-hungry, and contribute to climate change.
SEI works towards a shift to a clean energy future, from the level of global policy through to household cooking, and on biofuels and energy planning and modeling.
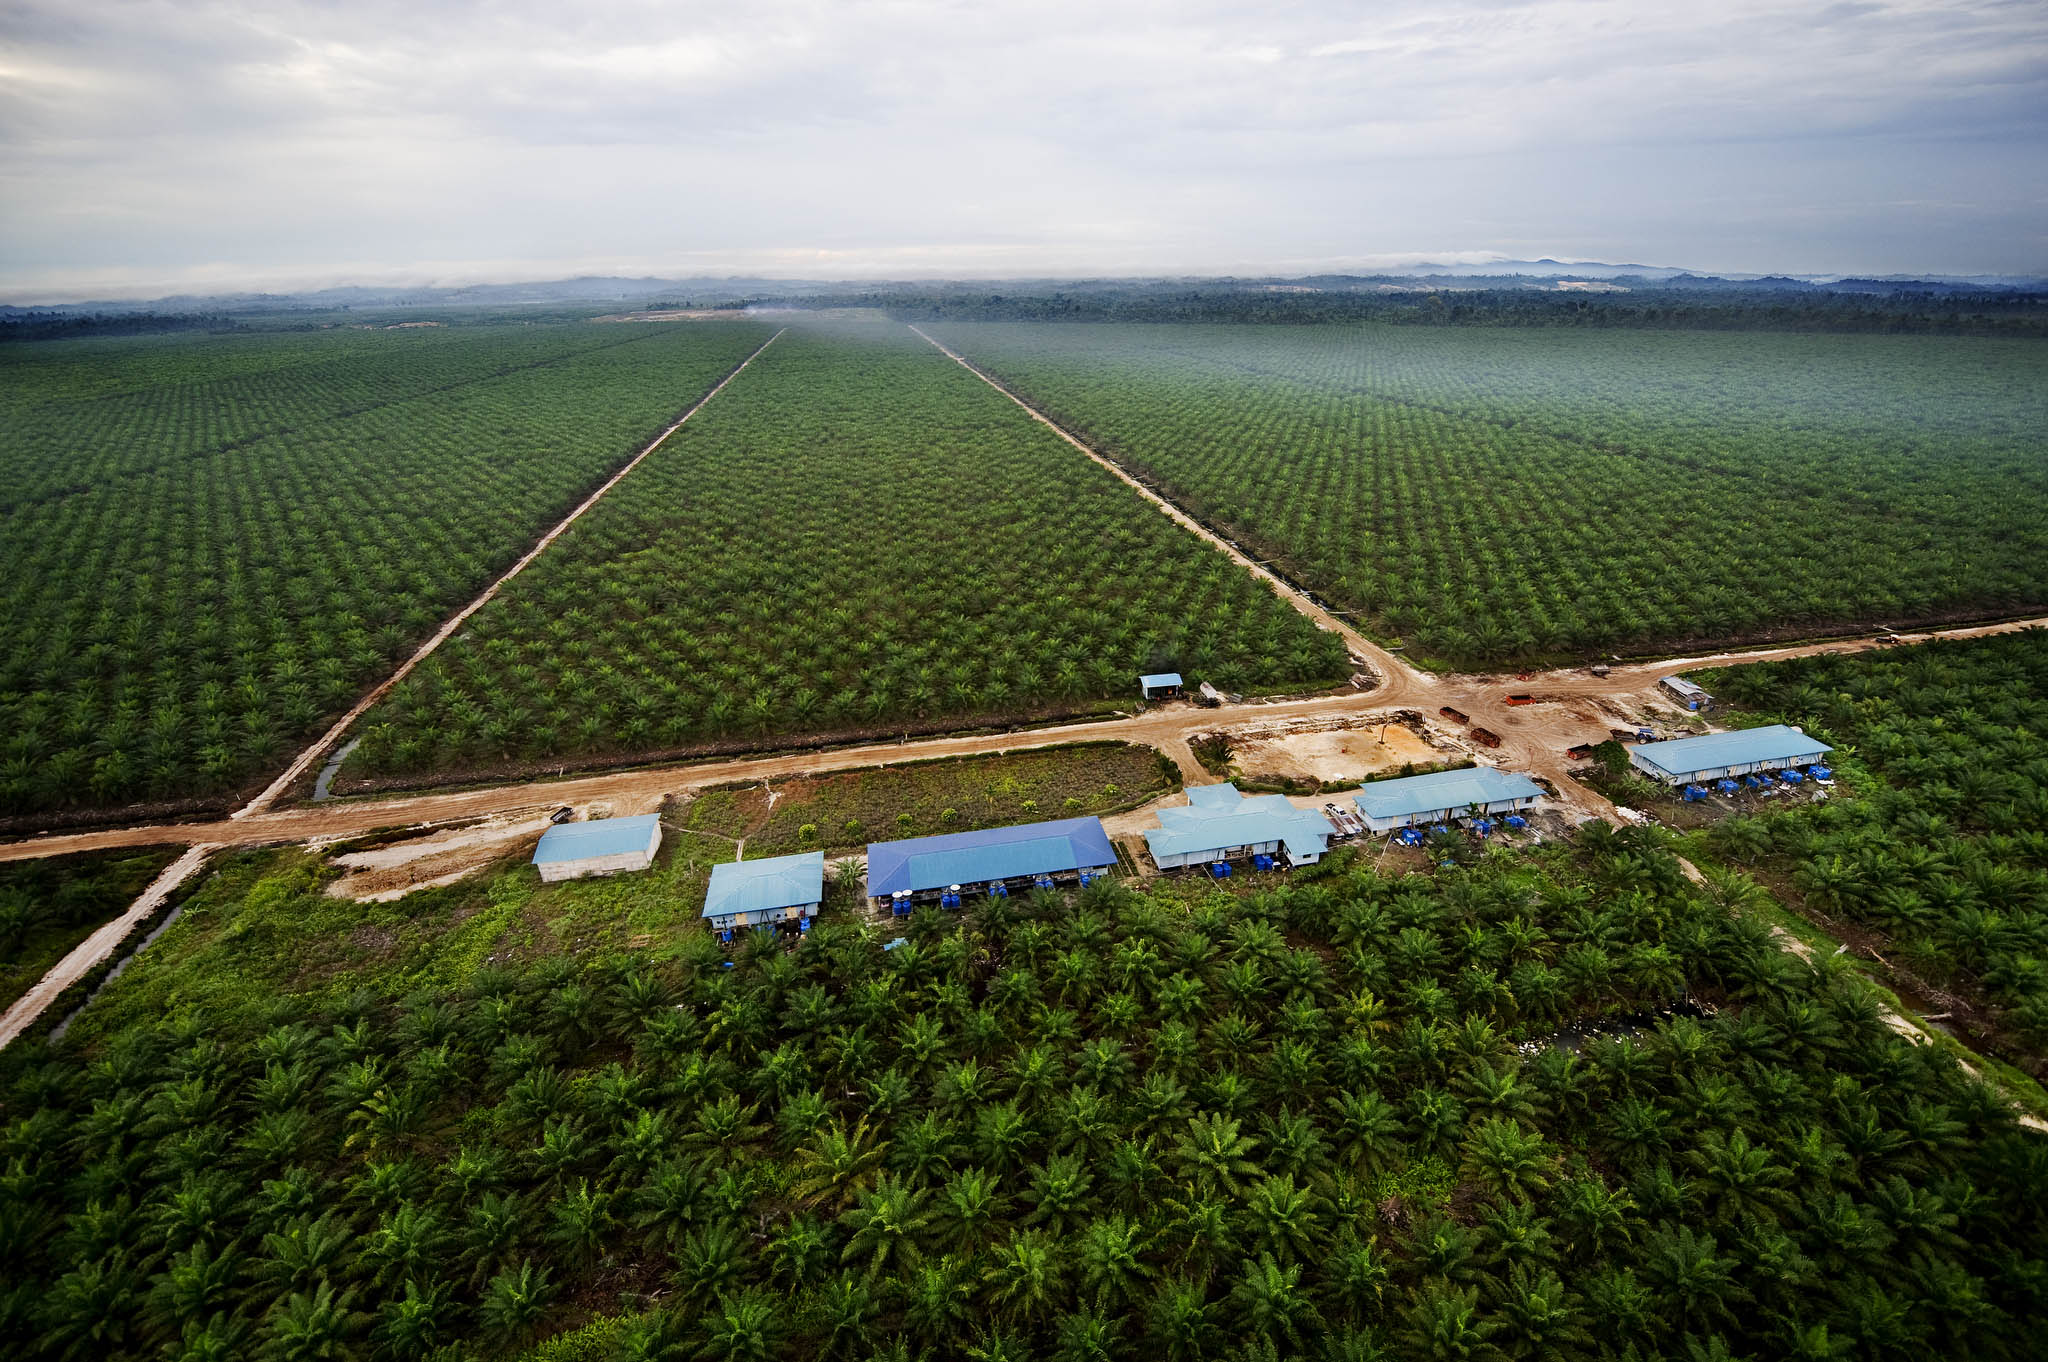
Notable work on energy last year includes research on the impacts of the Keystone XL pipeline in the U.S., analysis of the impacts of bioenergy projects in Tanzania and Indonesia, work on corporate accountability in biofuels production and on how energy access can play a key role as part of new Sustainable Development Goals.
Clean water, food, a balanced climate, soil fertility, good air quality, and natural resources and raw materials are just some of the benefits that ecosystems provide: sustainable development depends on functioning ecosystems.
We work at the intersection between human interests and healthy ecosystems to protect people’s wellbeing over the long term. Last year our research ranged from work with the Arctic council on ecological resilience in the region, a landmark assessment of the economic value of the world’s oceans, and support for the development of new sustainable development goals.
To make big cuts in greenhouse gas emissions we must transform our energy systems, how we use natural resources, and how we produce and consume goods and food. We will also need to adapt to the impacts of climate change, such as shifting seasonality and extreme weather events. SEI works towards a safer climate for all, focusing on effective, equitable ways to mitigate and adapt to climate change.
Explore the map to learn how last year we took steps to engage the business community on climate issues, developed practical guidance to guide decision-makers toward effective ways to adapt to climate change, and provided answers on how shifts in trade patterns can reduce greenhouse gas emissions.
quality
Good air quality is vital to human health, agriculture, and functioning ecosystems, and air pollution can have a big impact on the climate. SEI has been a pioneer in the field for many years, revealing the impacts of air pollution from the local to global scales, and working towards solutions.
In 2013 we developed further evidence on how reducing ozone and soot in the air can boost crop yields. We also generated ideas for transforming the market for clean cookstoves in India, and, through the international Climate and Clean Air Coalition, demonstrated how our LEAP energy-planning tool can help countries develop policy to cut pollution.
Water – the bloodstream of the biosphere – is fundamental to human development at all levels, from drinking water to irrigating crops and generating electricity. In a world in which there is increasing demand for limited supplies of water, and under shifting climate conditions, a key focus of SEI’s work is how to govern this precious resource in a connected way to ensure water, energy and food security for a world with nine billion people in 2050.
On the map you can find out about how we’ve developed a new tool to help planners in Africa use water better to increase food production, supported innovative sanitation projects in India, and put forward innovative approaches to flood risk in both Europe and Australia. Our research and engagement in water issues in the U.S. and Latin America has continued, as has our progressive work on integrating and applying our water and energy planning tools, WEAP and LEAP.
security
World population is likely to reach nine billion by 2050. How do we achieve food security for all in a sustainable way? The answer depends on how equitably and efficiently we manage land, water and other natural resources, how effectively we adapt to and mitigate climate change, and how we deploy technology.
Last year SEI examined how forests are critical to food security, revealed how smallholders in the Amazon could efficiently manage land and maintain environmental stability, and worked to integrate land-use issues into the ‘nexus’ concept. Explore the map to find out more.
The UN has projected that more than 65% of the world’s population will live in urban areas by 2050, with the rate of change especially fast in the developing world. This shift has major implications for how we use and consume resources and for energy, water and sanitation. At the same time, urbanization could also bring a range of potential benefits, especially efficiency gains.
Last year our innovative work at the urban scale included measuring the water footprints of Delhi, Lagos and Berlin, developing approaches for deep GHG reductions at the city scale, and new research on the impact of green space on city dwellers.
Explore our world
Select a topicFACTS, FIGURES AND FINANCE
These infographics highlight key events in our year in research, communications, partnerships and projects. There are also links to articles where you can find more information – click the arrows on the graphics to find out more.

Financial information
Our finances continued to strengthen in 2013, not least because of the Swedish Government’s decision to continue the increase in core support, from SEK 17 million in 2012 to SEK 27 million.
This investment has allowed us to further improve our core functions, take on new staff, and allowed investment in high profile areas of policy and research, in particular the Climate and Clean Air Coalition and the New Climate Economy project.
Another success in 2013 was that SEI Asia secured our first regional framework agreement with a bilateral donor (Sida). SEI York’s financial situation was also much improved.
Taken together, these developments have made it possible to embark on a more ambitious growth plan for recruitment and investment.
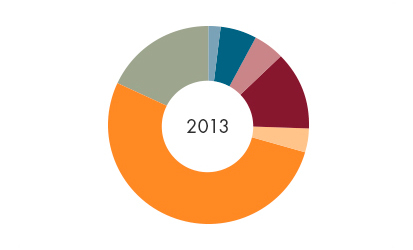
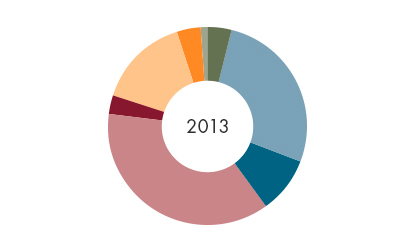
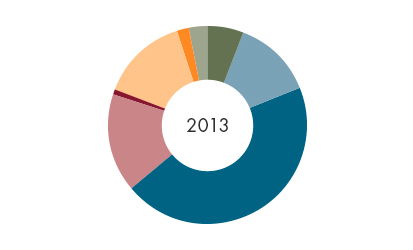
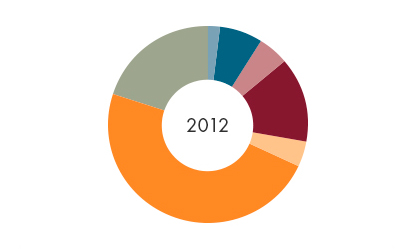
The charts below provide a broad overview of SEI’s finances in 2013, compared with the previous year. If you are interested in our full financial report and a list of funders and partners, you can find it on our website here:
| Centres | % | Research funding in sek millions |
| 100% | 150 | |
|
||
| SEI Africa | 2% | 2.3 |
| SEI Asia | 6% | 9.0 |
| SEI Tallinn | 5% | 6.9 |
| SEI York | 13% | 20.0 |
| SEI Oxford | 4% | 5.7 |
| SEI Stockholm/HQ | 53% | 78.8 |
| SEI US | 18% | 27.3 |
| Sources of finance by sector | % | Research funding in sek millions |
| 100% | 150 | |
|
||
| Bilateral Agencies | 27% | 40.3 |
| Foundations | 9% | 13.7 |
| Government | 37% | 56.1 |
| Research inst. & ngos | 3% | 4.5 |
| Multilateral agencies | 15% | 22.3 |
| Private sector | 4% | 6.6 |
| Universities | 1% | 1.3 |
| Banks & financial inst. | 4% | 5.5 |
| Geographic focus | % | Research funding in sek millions |
| 100% | 150 | |
|
||
| Africa | 13% | 20.1 |
| Global | 45% | 67.0 |
| Europe | 16% | 23.5 |
| Middle East | 1% | 1.4 |
| Asia Pacific | 14% | 21.0 |
| USA | 2% | 3.5 |
| Arctic | 3% | 4.7 |
| South & Central America | 6% | 8.8 |
| Centres | % | Research funding in sek millions |
| 100% | 139 | |
|
||
| SEI Africa | 2% | 2.4 |
| SEI Asia | 7% | 9.1 |
| SEI Tallinn | 5% | 6.8 |
| SEI York | 14% | 19.6 |
| SEI Oxford | 4% | 6.0 |
| SEI Stockholm | 48% | 67.3 |
| SEI US | 20% | 27.8 |
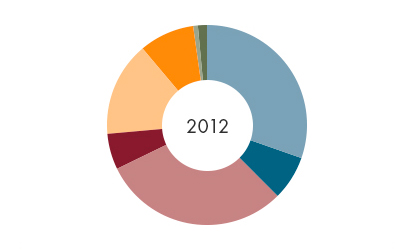
| Sources of finance by sector | % | Research funding in sek millions |
| 100% | 139 | |
|
||
| Bilateral Agencies | 30% | 42.2 |
| Foundations | 7% | 9.9 |
| Government | 30% | 42.0 |
| Research inst. & ngos | 6% | 8.0 |
| Multilateral agencies | 15% | 21.2 |
| Private sector | 9% | 12.4 |
| Universities | 1% | 1.1 |
| Banks & financial inst. | 1% | 2.0 |
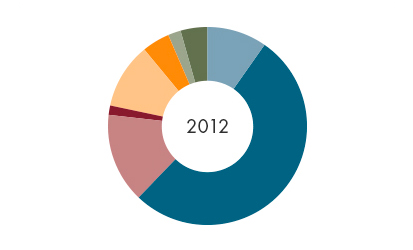
| Geographic focus | % | Research funding in sek millions |
| 100% | 139 | |
|
||
| Africa | 10% | 13.5 |
| Global | 53% | 72.8 |
| Europe | 15% | 20.3 |
| Middle East | 2% | 2.1 |
| Asia Pacific | 11% | 14.9 |
| USA | 4% | 6.2 |
| Arctic | 2% | 2.9 |
| South & Central America | 4% | 6.1 |
TELL US WHAT YOU THINK
Did you find the map interesting and fun to use? Did it give you a picture of the work we do and how issues are linked? Overall, was the report clear and informative? What impression of SEI did it leave you with? Was there any information you would have liked to have that wasn't included? How could the report be improved?
WE’D REALLY LIKE TO HEAR YOUR VIEW
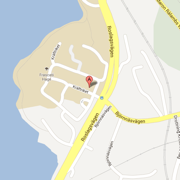
SEI addresses
Linnégatan 87D
115 23 Stockholm
Sweden
Letters:
Box 24218
104 51 Stockholm
Sweden
Tel: +46 8 30 80 44
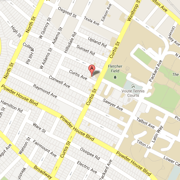
Somerville, MA
02144-1224
USA
Tel: +1 (617) 627-3786
California office
Tel: +1 (530) 753-3035
Seattle office
Tel: +1 (206) 547-4000
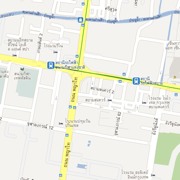
254 Chulalongkorn University,
Chulalongkorn Soi 64,
Phyathai Road, Pathumwan,
Bangkok, 10330
Thailand
Tel: +66 225 144 15
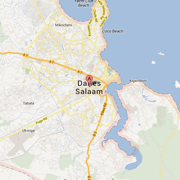
United Nations Avenue, Gigiri
P.O. Box 30677
Nairobi, 00100, Kenya
Tel: +254 207 224 886


